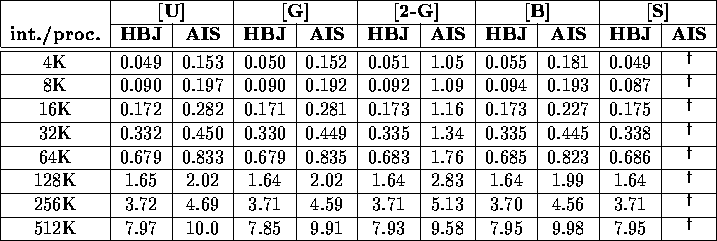
Table: Total execution time (in seconds) required to sort a variety of benchmarks and problem sizes, comparing our version of sample sort (HBJ) with that of Alexandrov et al. (AIS) on a 32-node CM-5.
Despite the enormous theoretical interest in parallel sorting, we were able to locate relatively few empirical studies. Of these, only a few were done on machines which either were available to us for comparison or involved code which could be ported to these machines for comparison. In Tables ix and x, we compare the performance of our sample sort algorithm with two other sample sort algorithms. In all cases, the code was written in SPLIT-C. In the case of Alexandrov et al. [1], the times were determined by us directly on a 32 node CM-5 using code supplied by the authors which had been optimized for a Meiko CS-2. In the case of Dusseau [17], the times were obtained from the graphed results reported for a 64 node CM-5.

Table: Total execution time (in seconds) required to sort a variety
of benchmarks and problem sizes, comparing our version of sample
sort (HBJ) with that of Alexandrov et al. (AIS) on a
32-node CM-5.
![]() We were unable to run the (AIS) code on this
input.
We were unable to run the (AIS) code on this
input.

Table x: Time required per element (in microseconds) to sample sort
64M integers, comparing our results (HBJ) with those
obtained from
the graphed results reported by Dusseau (DUS) on a 64 node CM-5.

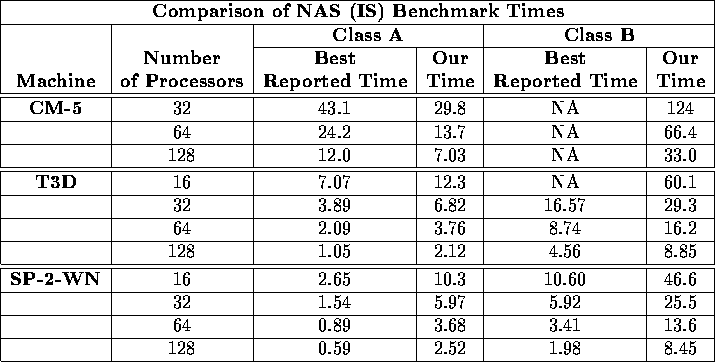
Table xi: Comparison of our execution time (in seconds) with the best
reported times for the Class A and Class B
NAS Parallel Benchmark for integer
sorting. Note that while we actually place the integers in sorted
order, the benchmark only requires that they be ranked without
actually reordering.
Finally, there are the results for the NAS Parallel Benchmark
[30] for Integer Sorting (IS). The name of this benchmark is
somewhat misleading. Instead of requiring that the integers be placed
in sorted order as we do, the benchmark only requires that they be
ranked without any reordering, which is a significantly simpler task.
Specifically, the Class A Benchmark requires ten repeated rankings
of a Gaussian distributed random input consisting of ![]() integers ranging in value
from 0 to
integers ranging in value
from 0 to ![]() .
The Class B Benchmark is similar, except that the input consists of
.
The Class B Benchmark is similar, except that the input consists of
![]() integers ranging in value from 0 to
integers ranging in value from 0 to ![]() .
Table xi compares our results on these two variations of
the NAS Benchmark with the best reported times for the CM-5, the T3D,
and the SP-2-WN. We believe
that our results, which were obtained using high-level, portable code,
compare favorably with the other reported times, which were obtained by
the vendors using machine-specific implementations and perhaps
system modifications.
.
Table xi compares our results on these two variations of
the NAS Benchmark with the best reported times for the CM-5, the T3D,
and the SP-2-WN. We believe
that our results, which were obtained using high-level, portable code,
compare favorably with the other reported times, which were obtained by
the vendors using machine-specific implementations and perhaps
system modifications.

Table xii: Total execution time (in seconds) required to sort 8M signed
integers, comparing
our results (HBJ) with those of Tridgell and Brent (TB) on a 32 node CM-5.
The only performance studies we are aware of on similar platforms for generalized sorting are those of Tridgell and Brent [32], who report the performance of their algorithm using a 32 node CM-5 on a uniformly distributed random input of signed integers, as described in Table xii.