 -Connected Components
 -Connected Components
Previous:
  -Connected Components
 -Connected Components
Thus, for  , the total complexities for the parallel
 -Connected Components algorithm are [4]
Clearly, the computational complexity is the best possible
asymptotically. As for the communication complexity, intuitively a
latency factor  has to be incurred during each merge operation,
and hence the factor
  .
.

Table I: Implementation Results of Parallel Connected Components of
DARPA II Image ( )
)
The majority of previous connected components parallel algorithms are architecture- or machine-specific, and do not port easily to other platforms. Table I shows some previous running times for parallel implementations of connected components on the ``DARPA II Image'' given in Figure 6. The second to last column corresponds to a normalized measure of the amount of work per pixel, where the total work is defined to be the product of the execution time and the number of processors. In order to normalize the results between fine- and coarse-grained machines, we divide the number of processors in the fine-grained machines by 32 to compute the work per pixel site.

Table II: Implementation
Results of Segmentation Algorithm on Image 3 from
[13], seven grey circles ( )
)

Table III: Implementation
Results of Segmentation Algorithm on Image 6 from [13],
a binary tool ( )
)
Our implementation also performs better compared with other recent
parallel region growing codes ([13]). Note that this
implementation uses data parallel Fortran on the TMC CM-2 and CM-5
machines, and lower-level implementations on the CM-5 using Fortran
with several message passing schemes. For example,
Figure 7 shows two of the more difficult images from
[13] which are segmented by region growing. Image 3 is a
256-grey level  image, containing seven homogeneous
circles. Image 6 is a binary
  image of a tool.
Tables II and III show the comparison
of execution times for Images 3 and 6, respectively. Because these
images are noise-free, our algorithm skips the image enhancement task.

Table IV: Segmentation Execution Time (in ms) for  band 5 image

Table V: Segmentation Execution Time (in ms) for  band 5 image

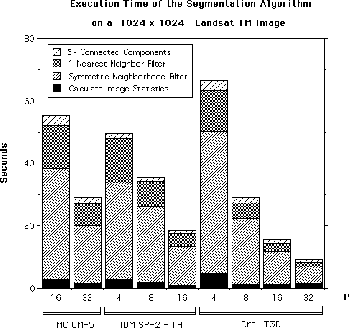
Figure 5: Scalability of the Segmentation Algorithm

Table VI: Total SNF
Execution Time (in seconds) for  band 5 image
Execution timings for segmentation of the  Landsat
TM band 5 subimage, shown in Figure 8, are given in
Table IV. Corresponding results are given in
Table V for a larger
  subimage
of the same view. Note that the SNF and 1-Nearest Neighbor filters are iterative
and data dependent, with timings that ramp down after the initial
iteration; thus, only the slowest timing for a single iteration is
reported. Figure 5 shows scalability of the
segmentation algorithm running on the
  subimage,
with various machine configurations of the CM-5, SP-2, and T3D. For
this image, the first, second, and third phases of SNF iterate 4,
56, and 47 times, respectively. Also, the 1-Nearest Neighbor task contains 11
iterations. Table VI compares the best-known
sequential code for SNF to that of the parallel implementation. Again,
this test uses the
  image, and iterates with the
counts specified above. The sequential tests are performed on fast
workstations dedicated to a single user and reflect only the time
spent doing the filter calculations. These empirical results show our
segmentation algorithm scaling with machine and problem size, and
exhibiting superior performance on several parallel machines when
compared with state-of-the-art sequential platforms.
 -Connected Components
Previous:
  -Connected Components