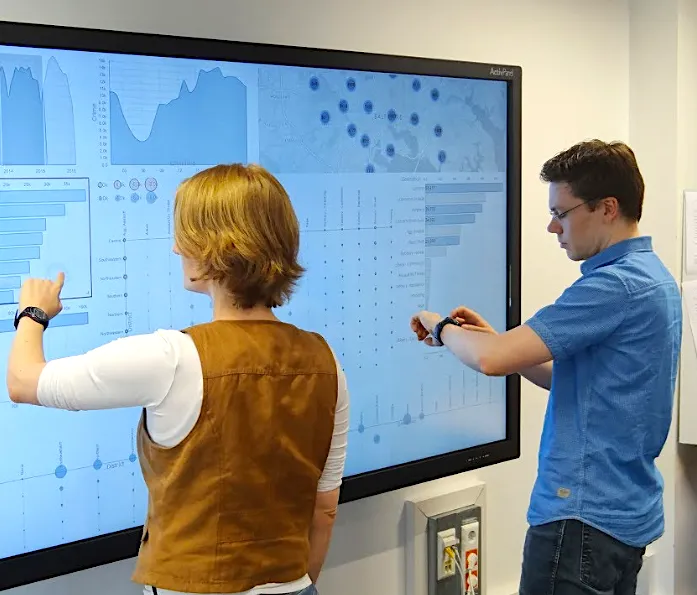
Huge, interactive display monitors are becoming increasingly popular for viewing large data sets involving maps, bar charts and line graphs. These monitors can show more information than traditional displays by enlarging, combining or coordinating multiple data viewpoints. They also feature physical navigation tools that can support multiple users working simultaneously.
For all their advantages, however, these large displays also yield new challenges. Tools and menus on the monitor often clutter the interface and obscure important information—and may also be out of reach for a user—forcing extra physical movement that leads to user fatigue.
A team of University of Maryland data visualization experts is addressing this problem by combining the powerful interactive features of large display monitors with the convenience and portability of smartwatch technology.
This innovative use of joining both large and diminutive visualization tools is detailed in a paper presented this week at ACM CHI 2018, the top conference for human-computer interaction held this year in Montreal, Canada.
“We want to take advantage of the powerful analysis capabilities afforded by these large interactive displays, while also making sure that the technology is user-friendly,” says Niklas Elmqvist, an associate professor in the College of Information Studies (iSchool) with an appointment in the University of Maryland Institute for Advanced Computer Studies who is working on the project.
Elmqvist is part of a multi-institutional team that includes Karthik Badam, a fifth-year UMD doctoral student in computer science, Raimund Dachselt, professor and head of the Interactive Media Lab at Technische Universität Dresden in Germany, and Tom Horak, a doctoral student at Dresden.
Badam and Horak were lead authors on the paper, which earned an honorable mention at CHI 2018, a distinction given to only five percent of the papers accepted. Horak is currently visiting UMD for the next six months, working with Elmqvist, Badam and others in the Human-Computer Interaction Lab (HCIL) on campus.
For part of the research detailed in their paper, the team studied an interactive model of police patrol routes in Baltimore, Maryland. They theorized the roles of two police analysts trying to build a tentative plan for patrol routes based on historical crime data within the city. The goal was to design routes that cover high-crime areas as much as possible, while still maintaining a police presence throughout the city.
To support the outlined scenario, the researchers needed a platform to view data records, store them as separate groups, and compare groups to each other. Furthermore, the platform would need to support modifying visualization properties to make comparisons more effective.
To answer these challenges, the team used secondary devices—in this case smartwatches—to augment visualization components, enhance user interactions, and ease the visual exploration.
By using a cross-device interaction for visual analysis, the team concluded that each of the devices—the large interactive monitor and the individual smartwatches— fulfilled different roles based on their strengths—the large display provided a multi-view interface, whereas the smartwatches augmented and mediated the functionalities by serving as a personalized toolbox.
The team believes their work will provide a starting point for a promising new class of multi-device environments, which in turn would be strongly beneficial for both current and future visual analysis tasks that involve large amounts of data.
Go here to see a video overview of the project.